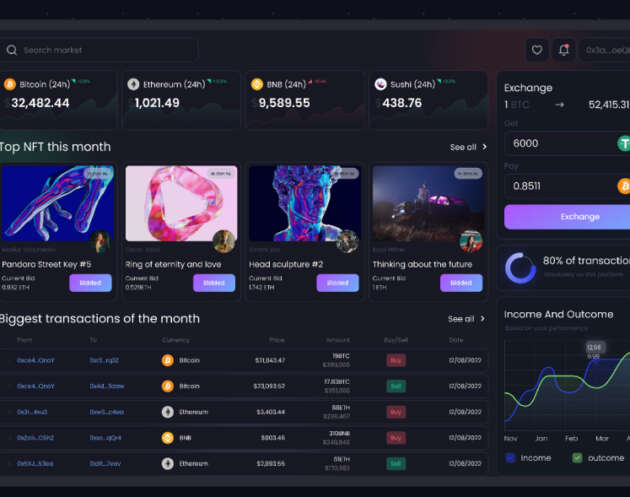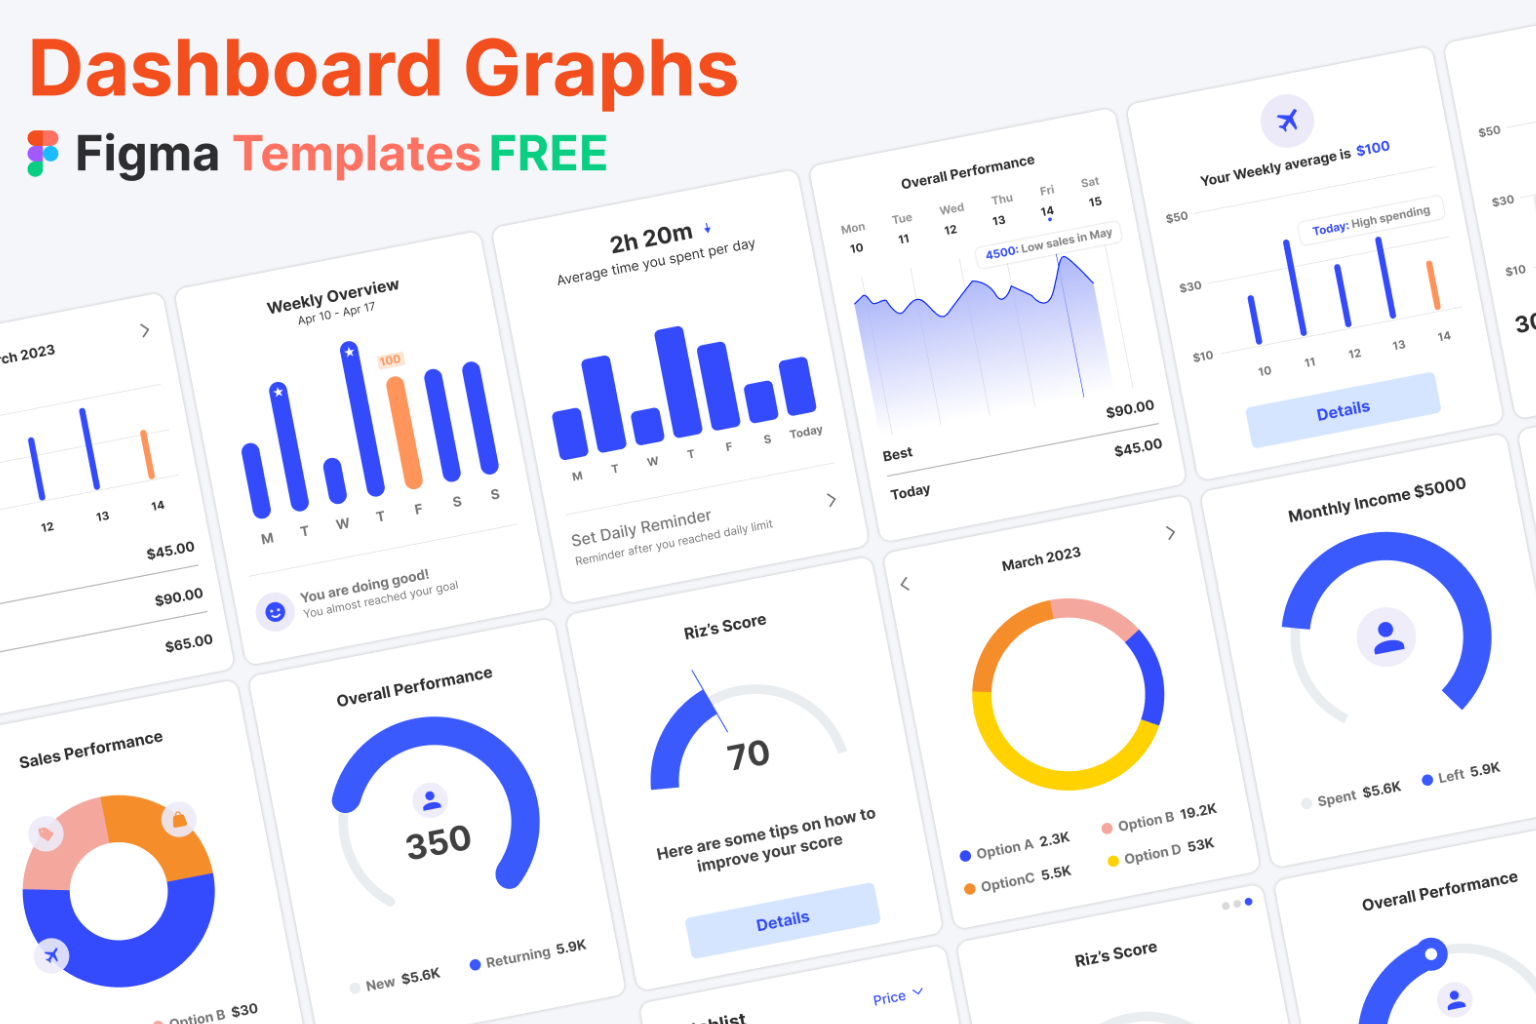
Download Dashboard Graphs UI Kit, a free Figma UI kit created to help designers build clear and visually consistent data visualizations for dashboards and analytics interfaces. This resource focuses on graph and chart components commonly used in modern software products, making it ideal for data driven design work.
Dashboards rely heavily on visual clarity. Well designed graphs help users understand trends, performance, and insights quickly. This UI kit provides reusable graph components that support better decision making through clear visual communication.
A UI Kit for Data Visualization and Analytics
This dashboard graphs UI kit is designed around common analytics patterns. It includes graph styles that work well for reporting, monitoring, and performance tracking across different industries.
It is well suited for:
- SaaS and product dashboards
- Analytics and reporting tools
- Admin panels and management interfaces
- Data visualization practice
- UI and UX portfolio projects
The components are flexible enough to adapt to different data types and use cases.
Designed for Clarity and Consistency
Effective dashboard graphs require consistent spacing, readable labels, and strong hierarchy. This UI kit helps designers maintain visual consistency across charts while keeping data easy to scan and interpret.
By using reusable graph components, teams can ensure that dashboards remain cohesive even as new metrics or sections are added.
Fully Editable and Organized in Figma
Built natively in Figma, this dashboard graphs UI kit is fully editable and easy to customize. Designers can adjust colors, labels, scales, and layout spacing to match brand guidelines or specific product needs.
The organized structure also makes it easy to collaborate and iterate, which is especially important when working on data heavy products.
What Is Included in This Dashboard Graphs UI Kit Figma Template?
This free Dashboard Graphs UI Kit for Figma includes:
- Graph and chart UI components
- Clean and reusable visualization elements
- Consistent spacing and layout structure
- Fully editable Figma components
- Ready to use design file
It provides a solid foundation for designing analytics focused interfaces.
Ideal For
This free Figma dashboard graphs UI kit is ideal for:
- UI and UX designers
- SaaS and product design teams
- Data visualization designers
- Admin and analytics dashboard projects
- Portfolio and learning exercises
If you are designing dashboards that rely on data clarity, this UI kit by Satish Kumar helps you work faster while keeping visuals consistent and professional.
Download Figma MockupReport missing link